Navigating the world of graphs and photosynthesis can be a real head-scratcher for many IGCSE/O Level Biology students. But fear not – Out-Class is here to be your guide on this academic journey, ensuring you not only grasp the concepts but emerge as a top scorer in your class!

Limiting Factors of Photosynthesis Explained
Below are some frequently asked IGCSE and O Level questions that have to be covered before we delve into limiting factors in photosynthesis graphs.
What are the three main limiting factors of photosynthesis?
-
Carbon dioxide concentration
-
Light intensity
-
Temperature
How do Limiting Factors Affect the Rate of Photosynthesis?
As the name suggests, limiting factors ‘limit’ the rate at which photosynthesis occurs. Let’s understand this using an example:
Example:
Suppose a plant has an abundance of carbon dioxide and the perfect temperature for photosynthesis but it is a cloudy day. In this situation, light intensity is acting as the ‘limiting’ factor on the rate of photosynthesis since it is at a suboptimal level. If we were to increase the light intensity, photosynthesis would progress more rapidly.
How to Find the Limiting Factor of Photosynthesis?
Usually, the limiting factor is the one which is at the most suboptimal level. In the example above, light intensity was low and the carbon dioxide concentration and temperature were optimal. Hence, light intensity was the limiting factor.
Now, let's further investigate by looking at limiting factors in photosynthesis graphs.

Graphs of Limiting Factors in Photosynthesis
Temperature Photosynthesis Graph:
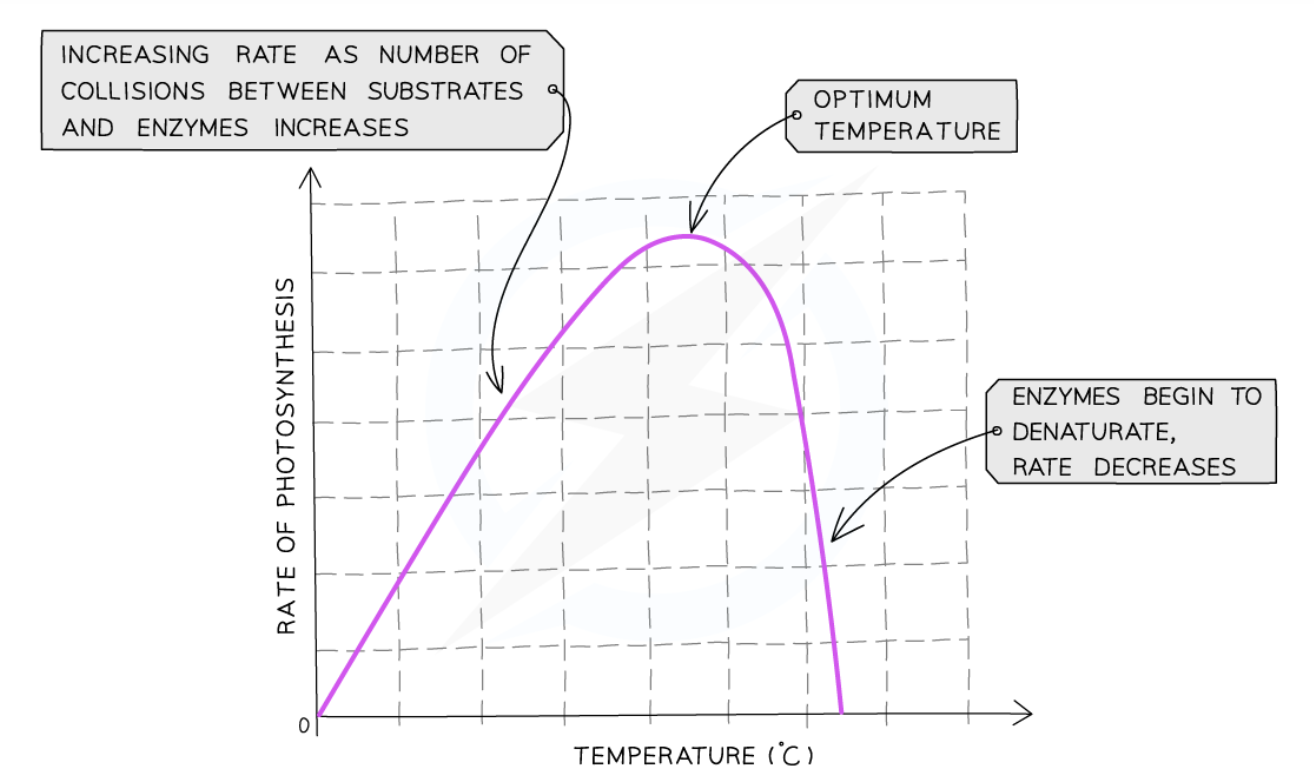
The effect of temperature on the photosynthesis graph can be observed in the diagram above. In the presence of ideal light intensity and carbon dioxide, temperature can become the limiting factor.
As you can see, as we initially increase temperature, the rate of reaction increases until we reach an optimal point. However, if we keep increasing the temperature beyond this point, the enzymes involved in photosynthesis become denatured and hence the reaction slows down.
If you are confused about why the rate of reaction increases initially with temperature, read our article on the rate of reaction!
Light Intensity Photosynthesis Graph
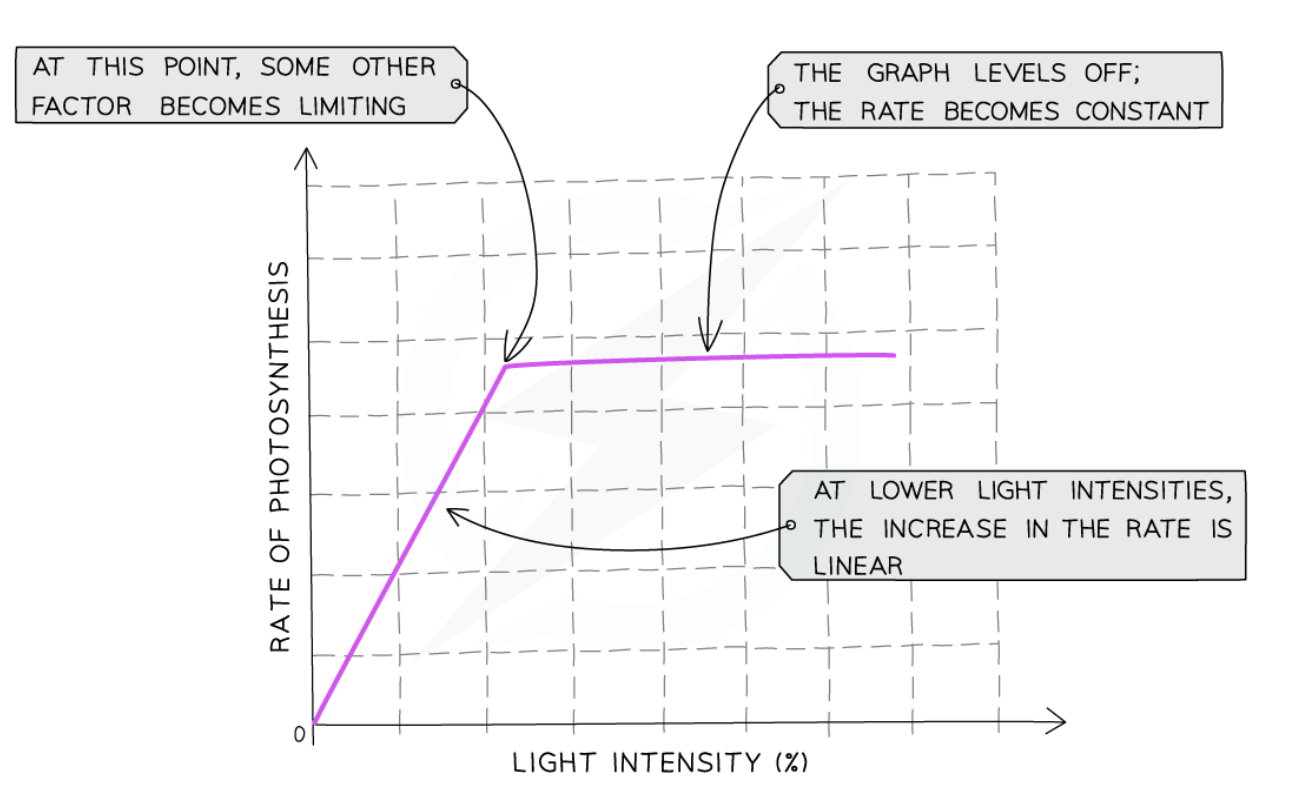
Look at how the rate of photosynthesis increases as we increase light intensity at the start. The diagonal part of the graph has light intensity as the limiting factor. Later, however, the graph levels off and no matter how much we increase the light intensity further, the rate of photosynthesis doesn’t increase. This indicates that in the flat part, some other factor (light carbon dioxide concentration or temperature) is limiting the rate of photosynthesis, not light intensity! This is a key O Level concept that is tested in MCQs.
Let’s look at an example:
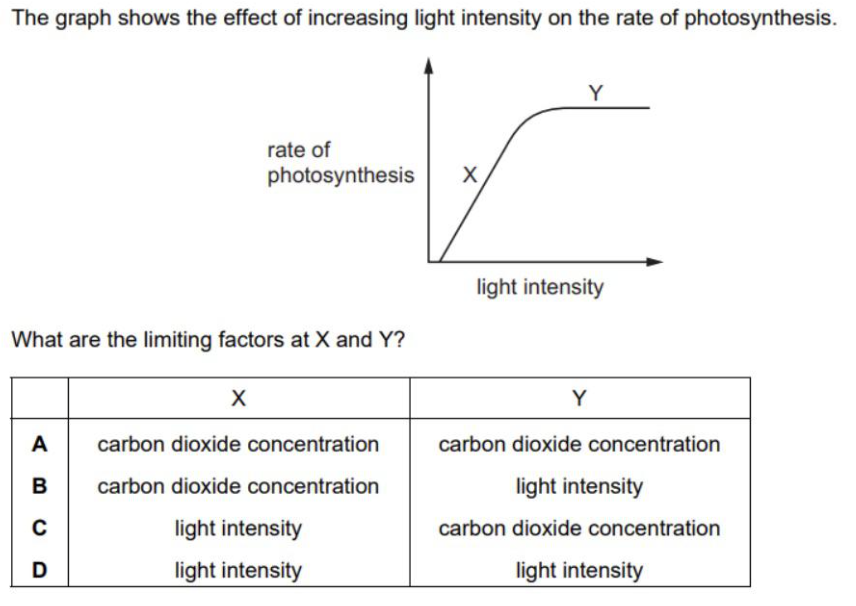
The correct answer is C. In the X segment, the rate of photosynthesis is determined by the light intensity because as we increase it, the rate increases. However, in the Y segment, the light intensity cannot be the limiting factor since its increase or decrease does not affect the reaction rate. Hence, other factors like CO2 concentration must be the limiting factor there!
Conclusion
In conclusion, we hope this guide has made the complex topic of photosynthesis and its limiting factors easier for you to understand. Getting a good grasp of these concepts is essential for doing well in your exams.
But why stop there? Out-Class offers a 25-hour IGCSE/O Level Biology crash course, designed to quickly and efficiently prepare you, covering key concepts in a way that ensures you're exam-ready in no time. Join us now!